
Maps and Plans in Vetusta Monumenta
By Elizabeth Baigent
Eighteenth-century England saw a flowering of mapmaking, mostly involving private individuals: commissioners, surveyors, makers, publishers, colourists, sellers, and users. The state survey body, Ordnance Survey, which began its main work at the end of the eighteenth century, came to dominate topographical mapping in the nineteenth, and its approach and style, themselves developed from earlier private mapping, set the tone for private mapping thenceforward. The survey board fostered standardization of style and scale; complete coverage of the land area; the use of modern scientific equipment and techniques; and the production of maps as a general resource, to be on hand to meet a variety of purposes as the need arose.
By contrast, in the eighteenth century there was more variety of style and scale; many maps were of individual places which appear as islands on the sheet; techniques and instrumentation were generally simple; and maps were produced for particular purposes rather than being a general resource. But while the eighteenth-century reading public did not have rigid expectations of the way maps should look, they increasingly expected to see them to help them visualize the point that the text was making and to provide geographical context for it. England was a characterised by a high degree of what has been termed “cartoliteracy” and “map consciousness,” that is, many middle- and upper-class English men and women could read maps and expected to see and use them in a variety of different contexts in their daily lives. These included managing their estates, finding their way when travelling, absorbing news and information in periodicals such as the Gentleman’s Magazine, locating places that they read about in their Bibles, decorating their walls, or attending to their geography lessons. Even children used them in educational play, assembling “dissected puzzles” (jig-saw puzzles) of maps. While some of these eighteenth-century maps, such as estate maps, were manuscript, there being no wide demand for maps of one family’s land, many of the others were engraved and printed. Printed maps appeared both within other publications, such as periodicals or books of views and plans, and as stand-alone items which were decorative objects from the start or became so when the information they depicted was superseded. The inclusion of engraved maps in printed volumes was matched by a similar increase in other types of printed images – prospects, views, building plans, portraits, botanical illustrations, and many others – as the relative cost of producing them went down and the expectations of the reading and viewing public rose.
Against this background we can consider the rather eclectic selection of maps and plans in Vetusta Monumenta. The first thing to say is that it is unsurprising to find them, and not just for the general reasons outlined above. Antiquarians used a variety of visual means, including maps, to record and disseminate information about their findings. A common impulse – pride in one’s locality – underlay the production of both county topographical maps and accounts of the county’s antiquities. Moreover, a sense that a map could capture not only the present topographical facts of a place but also something of its character and distinctiveness led to the inclusion of many topographical maps of threatened relics of the past. Perhaps the best example of this comes from over the border in Scotland. Here William Roy (FRS, FSA) led the great mid-eighteenth-century military mapping project which formed the prototype for Ordnance Survey. The map’s purpose was deadly serious: the 1745 Jacobite uprising, which had only just been suppressed, had shown the military advantage gained by those who knew the terrain. With this purpose uppermost in his mind, Roy excluded from his maps many features unrelated to military tactics and strategic planning; nonetheless he included numerous Roman and later antiquarian remains, such that his map gives a sense of Scotland’s distinctive history as well as its landscape.
We can now consider the individual maps and plans in Vetusta Monumenta in the order in which the plates appear, discussing not so much their content which is dealt with in their individual commentaries, but with their appearance, the cartographic strategies chosen for the task in hand, the work that that they do, and how they compare with other maps and plans that their viewers would be familiar with.
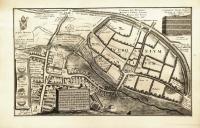
William Stukeley’s 1721 map of Verulamium (Plate 1.8) mixes attention to detail and precision in the antiquarian elements, which are the point of the map, with impressionistic and purely decorative elements in the surrounding parts. His use of two different scales (one for the detailed plan of the wall and a smaller one for the general map) suggests attention to accuracy in survey and measurement, while his orientation of the map with east approximately at the top produces a map which sits well on the page. These elements, plus his scale bars and compass rose, attest to his competence in surveying and mapping, and thus lend credibility to his antiquarian claims. Outside the antiquarian elements his aim is not so much accuracy as attractiveness. The broken column and capital by the cartouche reflect the common inclusion of classical ruins in landscape painting from the seventeenth century, but they are particularly appropriate here given the subject matter of the map. The trees lining the roads are indicative rather than accurate: given the representative strategy Stukeley chooses for them, he cannot include them on both sides without obscuring the road. Similarly, the hatching in the fields may suggest their undulating relief, but is just as likely to be simply occupying some white space, while the hill at centre bottom – named, but of a shape alien to the Hertfordshire landscape – shows Stukeley attending accurately to place names but not invariably to the visual depiction of landscape features.
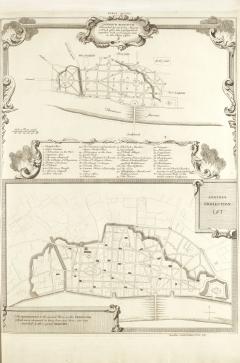
Like Stukeley’s plan, the second map in Vetusta Monumenta, Francis Drake’s Plan of the Roman Roads in Yorkshire (Plate 1.47), takes up the theme of Roman remains. Drake’s map, though, is at a far smaller scale than Stukeley’s and can best be understood in the context of the flowering of British, particularly English, county mapping in the eighteenth century. As Pete Wilson’s commentary on Plate 1.47 suggests, it is likely that Drake based his map on John Warburton’s Map of The County of York (1720), one of several eighteenth-century maps of Yorkshire which illustrate how growing pride in the county translated into an urge to own a map of it to decorate one’s walls or place in one’s library. Penelope Corfield has described how English county towns flourished in the eighteenth century as economic, administrative, social, cultural, and scholarly centres, and Rosemary Sweet traces the rise of county antiquarianism which explored and celebrated each county’s long and distinctive past. Canny cartographers took advantage of these trends by enlisting the county gentry as subscribers to their projects to produce county maps, and as purchasers of the resultant maps. Collectively there was a patriotic element to this county mapping. Recognising that the country as a whole was unevenly served by county maps and holding that such maps were crucial to the nation’s future, as well as a testimonial to its past, the London-based Society for the Encouragement of Arts, Manufacture and Commerce set out to encourage the production of county maps. In 1759 it introduced bounties, premiums, and prizes to encourage the accurate survey and production of printed county maps at a scale of one inch to one mile (approximately 1:63,000). From 1761 to 1809 just thirteen awards were made, but the cartographic stimulus was far wider, and the accuracy and scale prescribed by the society set the benchmark for mapping for decades to come. The one inch to the mile Ordnance Survey topographical maps, for example, followed the precedent established by county mapping.
Eventually all counties in England were covered by county maps, and Yorkshire caught the attention of some of the finest cartographers of the eighteenth century, including John Rocque, Thomas Kitchen, Emmanuel Bowen, and Thomas Jefferys. Warburton’s and Drake’s maps predate these men’s maps, and they predate the standardization promoted by the Society of Arts. Since Yorkshire was England’s largest county by some margin, many county mappers produced different maps for each of its three ridings. This strategy allowed larger scale (more detailed) coverage. Warburton instead tackled the whole county and his map needed seven sheets to accommodate it, even though its scale of 2 and a half miles to the inch (approximately 1:160,000) was smaller (less detailed) than the one inch to the mile which became standard. Drake’s map, though lacking a scale bar, was at a still smaller scale of about 1:420,000 or more than six miles to the inch and this, combined with his placement of the top of the map not quite at north, allowed him to fit the whole county on one sheet. Though small, the scale was large enough for his purpose which was fairly strictly confined to Roman roads, sites, and names, with other information included largely to help readers situate ancient features with respect to contemporary ones. In fact some apparently fixed contemporary features would have looked different in Roman times – the shape of Spurn Head at the mouth of the Humber, for example, is constantly changing with tidal, wind, and wave action – but this was not known at the time and was not Drake’s concern. A characteristic of many eighteenth-century county maps was a cartouche with elegant classical features such as putti, columns, Roman armour, and figures in classical drapery. These cartouches allowed the cartographer to flaunt his erudition, and to flatter that of his readers. Stukeley followed this convention with a broken column and capital nicely echoing the decline of the Roman city of Verulamium which his map depicted (see above). Ironically given the subject matter of Drake’s map, he includes neither a classical cartouche nor marginalia with classical motifs. All we have, apart from the rather austerely presented subject matter, is a brief dedication and a set of rather improbable looking sailing vessels. Such decorative elements, often added by the engraver and not the cartographer, were often used to fill otherwise white space. Contemporary readers did not see such fancifulness as detrimental to the credibility of the depiction of the map’s subject, though the mix of fancy and accuracy can be challenging for modern readers.
The next map to appear is “A True and Exact Draught of the Tower [of London] Liberties” (Plate 1.63). This elegant piece of work is one of four eighteenth-century versions of the now lost original plan of 1597, being an engraving of 1742 probably by George Vertue after an anonymous pen and ink drawing, probably not Vertue’s own (Keay 2001, 3), of William Hayward’s (or Haiward’s) and J. Gascoyne’s 1597 plan. The Society of Antiquaries’ engraving is, then, at some remove from the original. Such copying of maps was not unusual, particularly when the original was as important as this one: another version, a copy of a now lost eighteenth-century copy of the original, may be seen in the National Archives. The original was so important because it was “the only measured visual source” to set out the appearance of the tower before alterations in the seventeenth century (Keay 2001, vi). Keay points to an even earlier visual source, a fifteenth-century illuminated manuscript, but the key difference is that the Elizabethan survey is a measured visual source. The disappearance of the original plan is regrettable, though not unusual, but a useful feature of the copies is that they all give the survey date (1597), making it clear that they are copies. Such survey dates and indications of copying are particularly useful for interpreting maps. It was so expensive to make maps that “new” maps were often thinly disguised old ones, and the publication date of printed maps can sometimes give an optimistic view of the currency of the information they show. This was a serious problem in rapidly growing towns where reality might substantially part company with what was depicted on a map. Here the survey date anchors the work, and helpfully fixes both the features extant in 1597 and those which had disappeared by that time, for example, the “broken” tower in the Nine Gardens site which is described as having been reduced to the height of the rest of the wall by 1597.
“Draught” was one of the several names, including “plot” or “plat,” which were used for large-scale and fairly large-scale maps before the terminology had settled. Indeed, the commissioner of the original Elizabethan map referred to a “plotte” (Keay 2001, 10–11). The title declares it to be “true and exact,” a claim often made for maps which were nothing of the sort. Here, however, the claim seems plausible. The draught’s apparent authority is supported by the royal coat of arms (probably original to the 1597 plan), by the status of Sir John Peyton, lieutenant of the Tower, who commissioned the drawing (and who had military experience in the Netherlands, where he might well have gained familiarity with local high quality military maps), and by the high quality of Vertue’s engraving. One of the cartographers, Hayward, was an experienced land surveyor. The map was drawn to help resolve a dispute over jurisdiction which, like disputes about land ownership and profitable rights over land, was a common reason for the production of maps. Although such maps by themselves had no legal force, the air of authority that they imparted could lend weight to the argument of their commissioners.
As with the other maps described here, the depictions which are central to its purpose (the boundaries of the liberties) are given fully and commendably accurately, while some of the other information is indicative only: the trees and river vessels occupy space decoratively, and the buildings are in part schematic except where they have a function in fixing the disputed boundary. Similarly, while the ground plan is surveyed and measured, being the important consideration, the elevations of buildings are not, but are drawn freehand. To the left of the sheet we see the compass rose with north to the top. It is not clear if the compass rose is original or added by Vertue: it features on the copy from which Vertue made his engraving and in a different place on another copy (Robert Whitehand’s of January 1712/13), but at all events it seems likely that the original was orientated to the north – not something which was completely standard by 1597 but which works well visually with the Thames anchoring the representation at the bottom of the page and the information about the liberties ranged on the other three sides. At bottom left are a scale bar and dividers with “scala perticarum” indicating the scale in perches (1 perch = 5 and a half feet). The scale is about 1:800, so very large, and all the copies are drawn to the same scale which is, then, probably the scale of the original (Keay 2001, 5 and 7, note 34). The scale bar and dividers feature on all extant copies and so were probably there on the original. The impression of care and accuracy in the production of this map carries over into its text which was original to the 1597 plan: the Antiquaries’ minute book describes the “Alphabetical references” on the original plan (Keay 2001, 7n30). When Anna Keay describes the information on the map as “crammed in”, she intends only to praise its abundance (2001, 8). In fact the map is well laid out, and the result is aesthetically pleasing as well as informative, something which perhaps added to the reasons why so many copies of it were made.
By the time that Vertue produced his engraving, a firm connection had been established between the Tower of London and map making. Map, plans, models for military use had probably been stored at the Tower from the late seventeenth century and, from at least 1717 and possibly earlier, a map Drawing Room was established there. Here maps and models were produced for military use, and later Ordnance Survey maps were drawn and draftsmen trained. The men trained and employed there are closely related to the 1597 plan’s history. Robert Whitehand, whose 1712/13 copy is mentioned above, Clement Lemprière, author of a now lost copy of 1741, and Joseph Heath, whose 1752 copy of Lemprière’s version is extant, were all employed at the Tower Drawing Room, and Whitehand’s copy bears a bold red Board of Ordnance stamp (Marshall 1980; Hodson 1991; Down 2020; Keay 2001, 4, and plate 2). The thorough training of these men and their colleagues and the high standard of work coming out of the Tower gives confidence in the quality of their copies, and of Vertue’s engraving, which is remarkably similar to them. It also suggests that the draughtsmen’s professional appraisal judged the 1597 plan to be worth copying, for its high quality as well as its local connection.
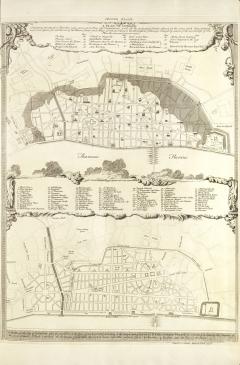
Plates 2.1-2.2 show John Evelyn’s and Christopher Wren’s schemes for rebuilding London after the Great Fire. As they considered the ruined city, many of those who had a vision for its recovery thought that rebuilding would best take place with the aid of maps. If the higgledy-piggledy nature of the pre-fire plots and streets and the irregular shapes of ancient churches were to be replaced by elegant geometric vistas and strictly proportioned façades, rebuilding plans and processes needed to be controlled, and the route to discipline was via objects independent of the land or buildings themselves, namely maps, plans, and/or models. Charles II well understood this, charging those responsible for the rebuilding of St Paul’s Cathedral to build “according to the design and model,” which was to “remain as a perpetuall and unchangeable rule and direction for the conduct of the whole Work” (commission charge of 1673, qtd. in “The Wren Office Drawings”). While models were used only for exceptional buildings, notably St Paul’s Cathedral, since they were very expensive to produce, a rash of mapping broke out, and cheap engraved paper plans jostled with one another for the attention of the public and those in authority. Evelyn’s and Wren’s plans for the new city, featured in Plates 2.1-2.2, are the most famous; Valentine Knight’s, not included here, is the most infamous. His loose grid plan was complemented by a canal to allow for new docks near the River Thames, the profits from which would go to the crown. Charles II, angered by the suggestion that he was looking to profit from what seemed to be a providentially ordained calamity, had Knight briefly imprisoned for his maladroit proposal. Evelyn’s and Wren’s plans are more orthodox, though in the end no unified scheme was realised, since the crown lacked the means to buy out landowners, and post-fire standardisation was largely confined to building materials and façade design. The Great Fire maps and models show the power of graphic media over narrative when it comes to visualising building schemes – though this success could prove dangerous. Not only was Knight imprisoned because his map made his cunning plan for royal profiteering all too clear, Wren got into trouble when his model and plans for St Paul’s cathedral showed viewers quite how far his new church departed from expectations of a safely Protestant building and followed Catholic baroque exemplars.
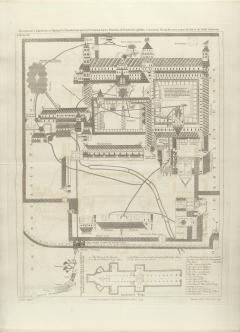
Plates 2.15–2.16 are based on redrawings of much earlier plans from the Eadwine Psalter. They show that mapping could flourish before the establishment of conventions that we now think of as integral to it. One such convention is the drawing of maps to scale such that one unit on paper strictly corresponds to one unit on the ground. All the maps above are scalar, even if, like Drake’s, they do not declare their scale. The medieval plans here appear not to have any elements drawn to strict scale. Scale mapping probably arrived in England in the sixteenth century but did not become the norm until much later. Being non-scalar does not make maps faulty. We are all used to maps, such as those for the London and other underground railway systems, which are topological rather than scalar, that is, they accurately depict the sequence and connectedness of stations but not the distance between them: that is not their concern. The plans of Canterbury reproduced here are similarly non-scalar and show the buildings and water courses in (approximately accurate) relation to one another, but neither size of feature nor distance from other features is rendered accurately. We do not know the exact purpose for which the plans were drawn, but we should start from the assumption that they were designed in a way which fulfilled their function for contemporaries, even if it is now opaque to us.
Further Reading:
Delano-Smith, Catherine, and Roger J.P. Kain. 1999. English Maps: A History. London: British Library.
Harley, J. Brian. 1963. “The Society of Arts and the Surveys of English Counties 1759-1809.” Journal of the Royal Society of Arts 112: 43-46,119-25, 269-75, 538-43.
Works Cited:
Corfield, Penelope. 2023. “British History: Town Life.” Blog post. Penelope J. Corfield. Accessed January 3, 2024. https://www.penelopejcorfield.com/british-history/town-life/.
Down, Emma. 2020. "Maps in the Drawing Room." Blog post. National Archives Blog. Accessed January 9, 2023. https://blog.nationalarchives.gov.uk/maps-in-the-drawing-room/#note-48953-2.
Hodson, Yolande. 1991. Map Making in the Tower of London: Ordnance Survey’s Early Years: An Exhibition to Celebrate the Bicentenary of Ordnance Survey. Southampton: Ordnance Survey.
Keay, Anna. 2001. The Elizabethan Tower of London: The Haiward and Gascoyne Plan of 1597. London: London Topographical Society with Historic Royal Palaces.
Marshall, Douglas W. 1980. "Military Maps of the Eighteenth Century and the Tower of London Drawing Room." Imago Mundi 32: 21–44.
Reddaway, Thomas Fiddian. 1940. The Rebuilding of London after the Great Fire. London: Jonathan Cape, 1940.
Sweet, Rosemary. 2004. Antiquaries: The Discovery of the Past in Eighteenth-Century Britain. London: Hambledon and London.
"The Wren Office Drawings: 1673: Designs for the Great Model." Accessed January 3, 2024. https://www.stpauls.co.uk/1-designs-for-great-model-1673.
This page references:
- Plate 1.8: Engraving of a Plan of Ancient Verulamium
- Plate 2.1: Engraving of Plans for Rebuilding London, 1666 (1 of 2)
- Plate 2.2: Engraving of Plans for Rebuilding London, 1666 (2 of 2)
- Plate 1.47: Engraving of a Plan of the Roman Roads in Yorkshire
- Plate 1.63: Engraving of a Plan of the Tower Liberties, 1597
- Plate 2.15: Engraving of Canterbury Cathedral and Priory with a Portrait of Eadwine (1 of 2)